


Who Were the ‘Lucky Winners’ at the 2023 US Open?
Who Were the ‘Lucky Winners’ at the 2023 US Open?

Lucky losers are the rare few in tennis who are given a chance to win an event despite losing a match. In practice, given a recent match loss, there is hardly a risk that a lucky loser ever makes good on this chance. This can make the inclusion of lucky losers in an event’s’ draw feel like nothing more than a placeholder. Nevertheless, it is a designation that has become a fixture of the sport.
A related but less easily recognizable group of players are the players who advance to the next round of an event despite a poor performance (at least realtively so). I am going to refer to this group as ‘lucky winners’. As viewers, we usually have a feel for a lucky win when a match is closer than expected or the match play was downright ugly. The purpose of this post is to try to better quantify a lucky win, using the recent results at the US Open.
An upset is of course a kind of lucky win. But here we are less interested in a win that wasn’t expected from the start and more interested in a win that may be surprising given a player’s actual match performance. So it is more about the players who may have just edged out a win rather than the underdogs who managed a big result.
Our player skill ratings are a way to compare each player’s expected serve and return performance – against the specific opponent being faced – to their actual performance. Since we can do this for both the winners and losers of matches, we can identify the winners who performed below their expectation on each skill dimension.
Figure 1 picks out the men’s winners in the R16 or later who under performed their serve expectation at the 2023 US Open. There are only four examples where this happen and in two cases – Zverev’s win over Jannik Sinner and Shelton’s upset of Tommy Paul – ‘underperformance’ is a bit of a stretch since the gap between expected and actual serve performance ins quite small. But for two instances, the gap is notable. One such case was Novak Djokovic’s QF win over Taylor Fritz. The straight-set defeat may have seemed definitive but Djokovic’s total service points won of 64% was less than the >70% win percentage that was expected.
Figure 1. Match winners who performed below expectation on serve win percentage in the R16 or later along with their opponent’s performance.
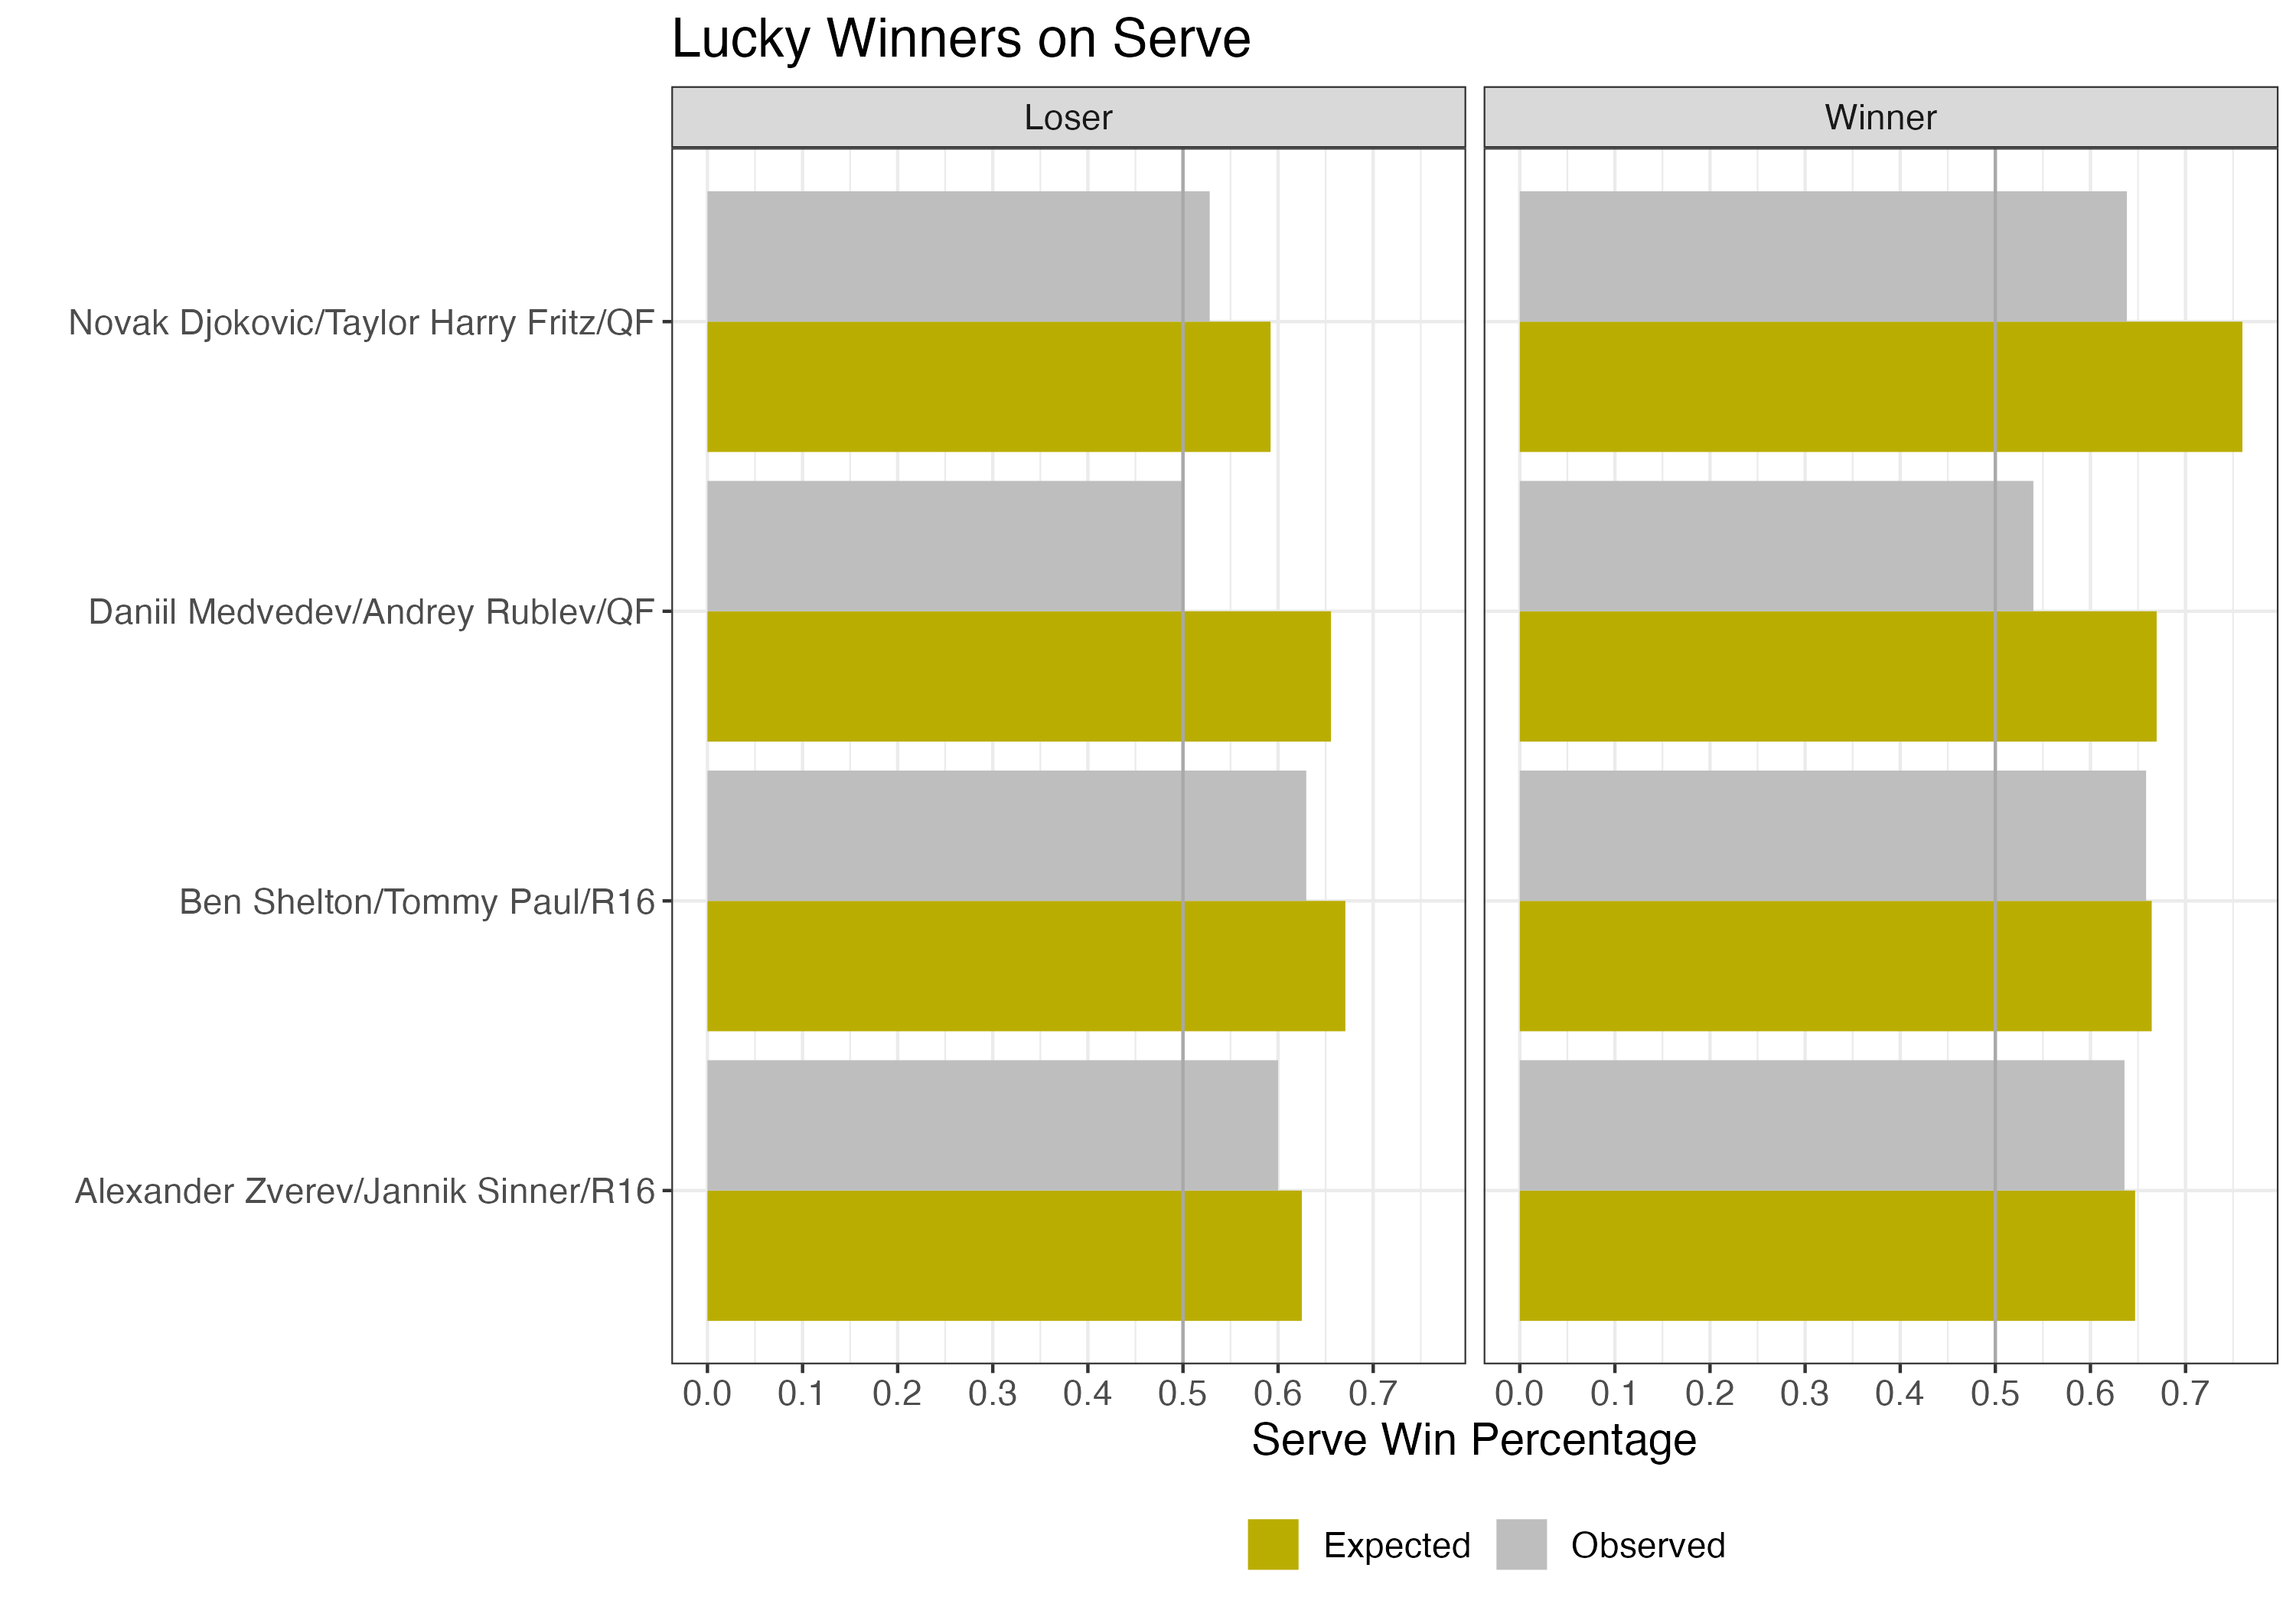
The second men’s serve case with the largest gap was another quarterfinal: Daniil Medvedev’s win over countryman Andrey Rublev. Another straight set win but at just 54% of service points won, Medvedev’s service game was not up to what was anticipated.
In both cases, the saving grace for Djokovic and Medvedev was that their opponents were also playing below their expected level. Rublev’s gap being the most notable of all four players as he only managed to win 1 of every 2 service points on average. So, while, Djokovic and Medvedev may have gotten away with a less than ideal serve performance in the quarterfinals they both did all that was required in still managing to out serve their opponents.
If we apply the same exercise to the return game, we find two performances where the winner was below their return win expectation by more than a few percentage points (Figure 2). Many were probably surprised by Medvedev’s win over Carlos Alcaraz, and we see now that he achieved that with less of his defensive skill than predicted. While Medvedev was expected to return at 44%, his actual percentage for the semifinal was 38%. But, again, Medvedev benefited from Alcaraz being even further off target on return, winning a mere 29% of return points.
Figure 2. Match winners who performed below expectation on return win percentage in the R16 or later along with their opponent’s performance.
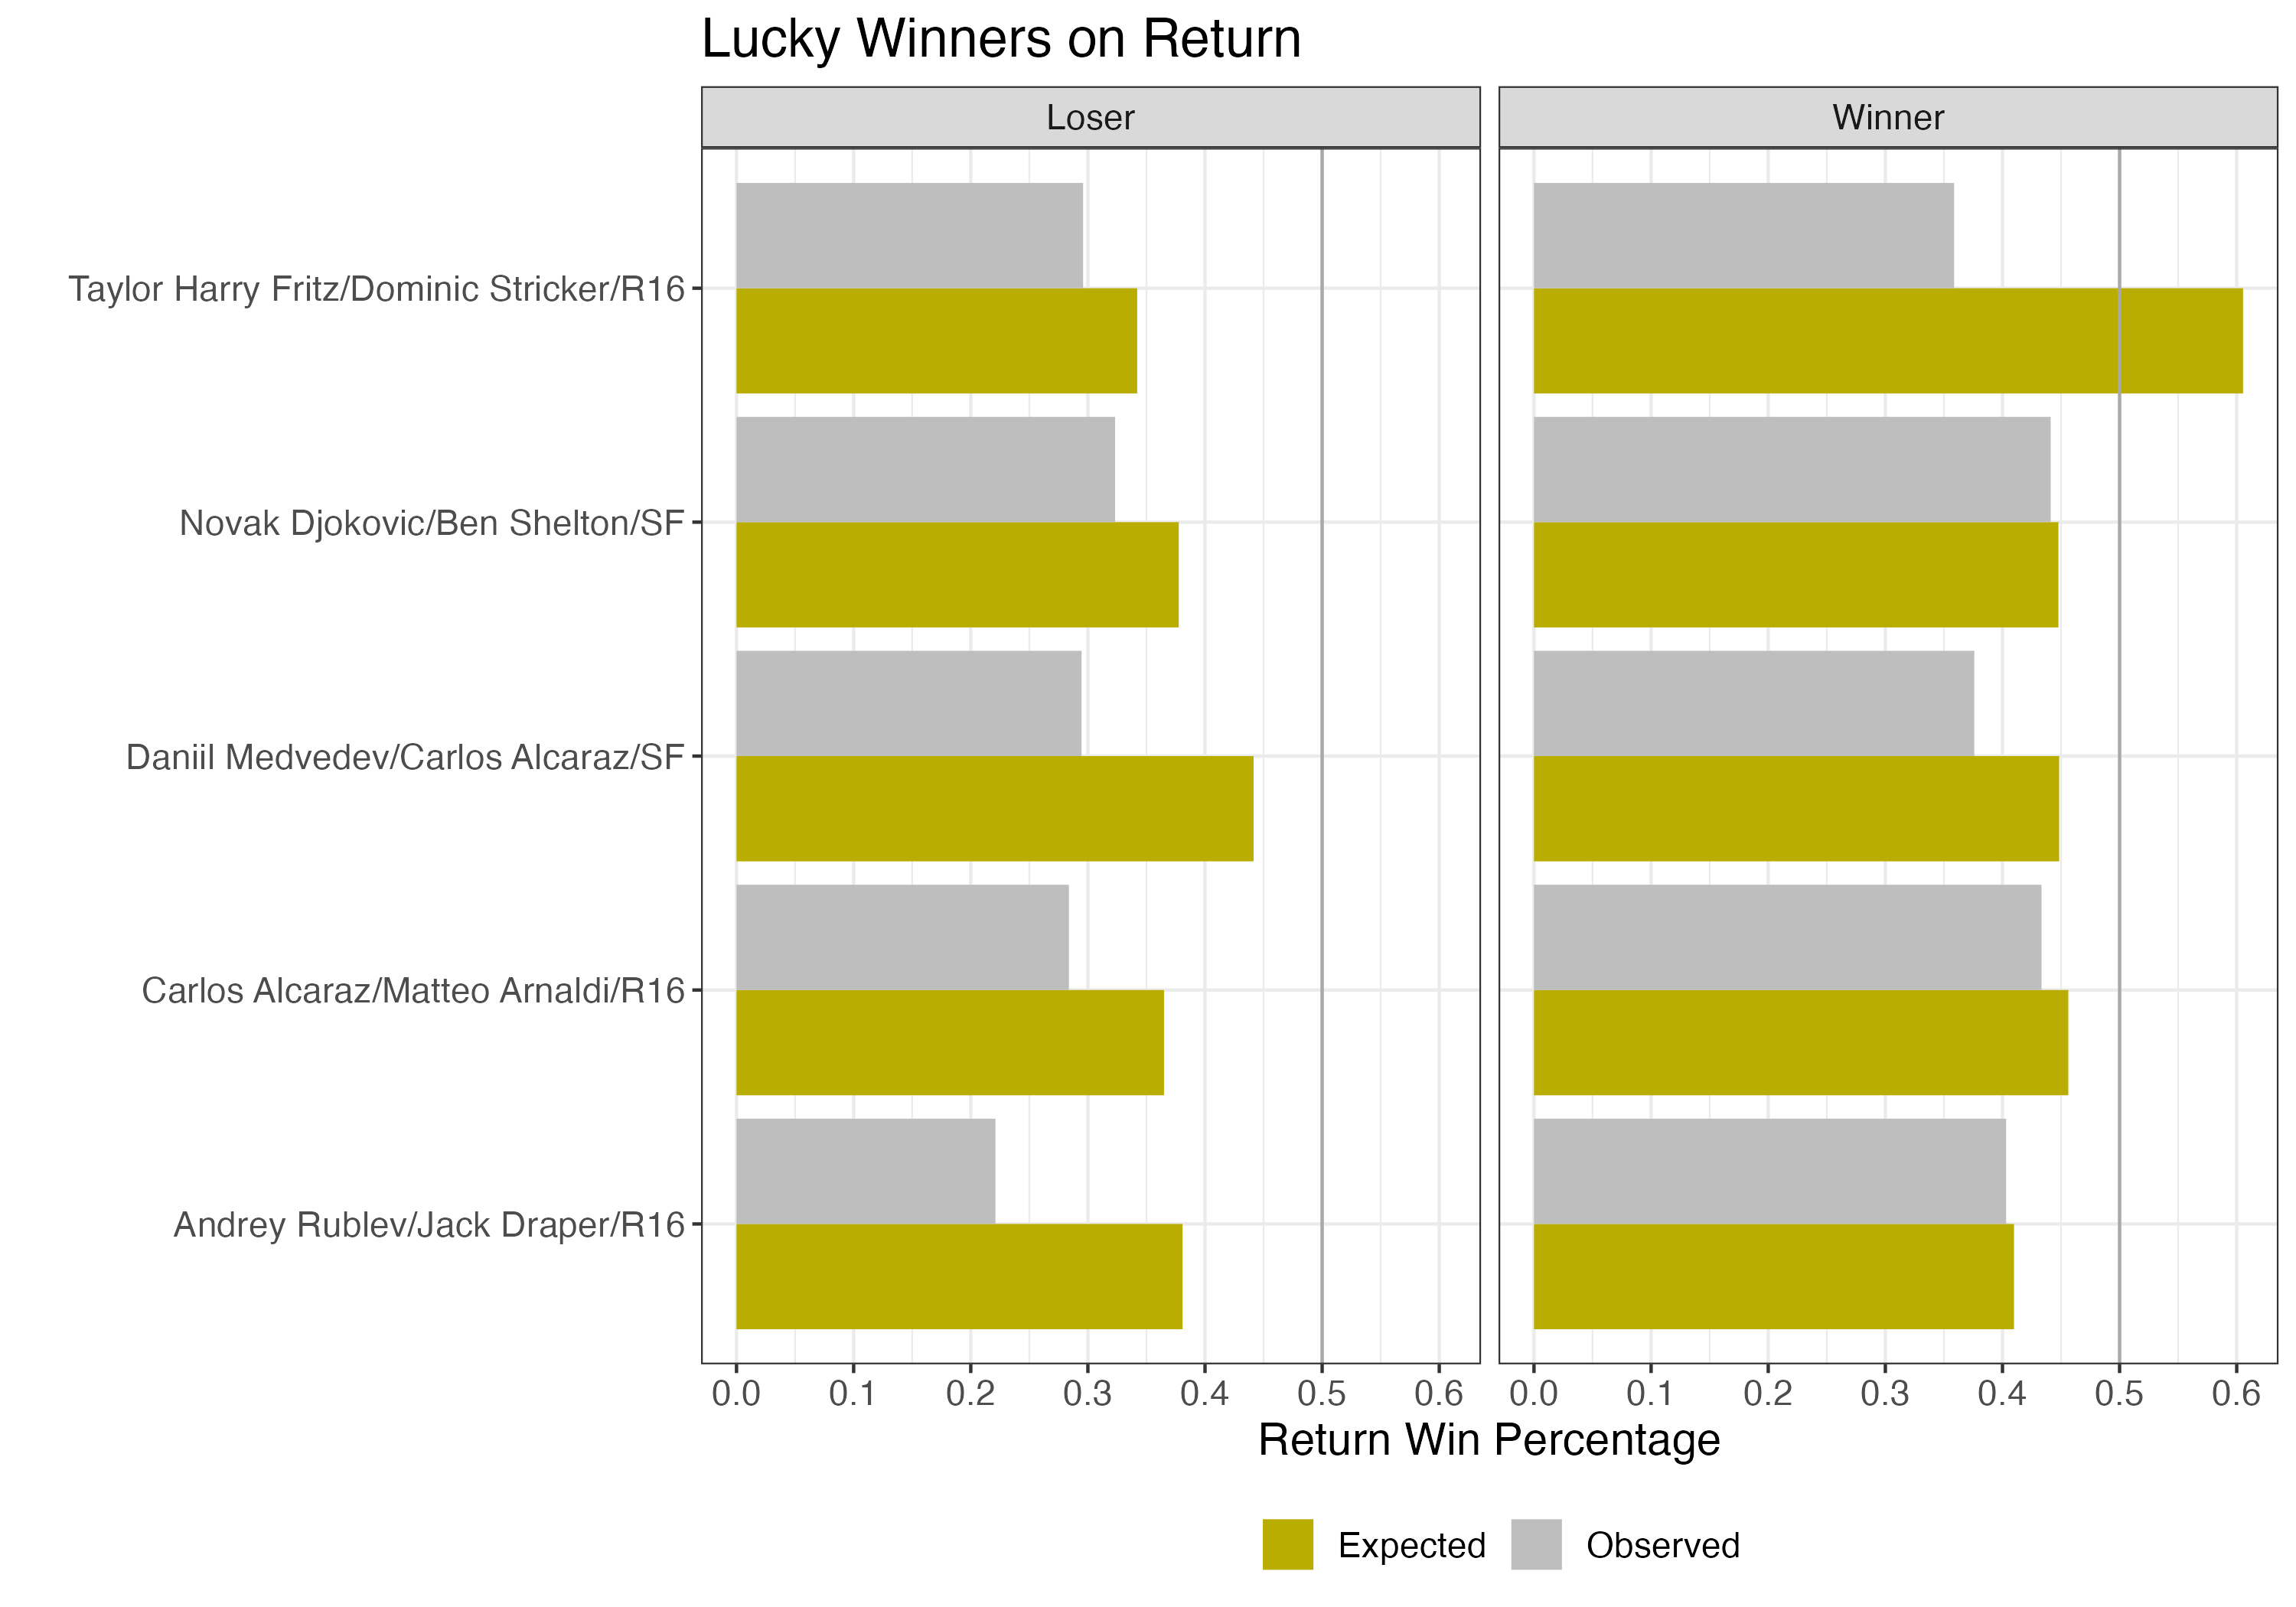
Fritz got away with the largest deficit on return in his R16 win over Dominic Stricker. Fritz was expected to win the majority of points on return but earned just 36% of points won. Yet Stricker wasn’t able to take more advantage of this gap.
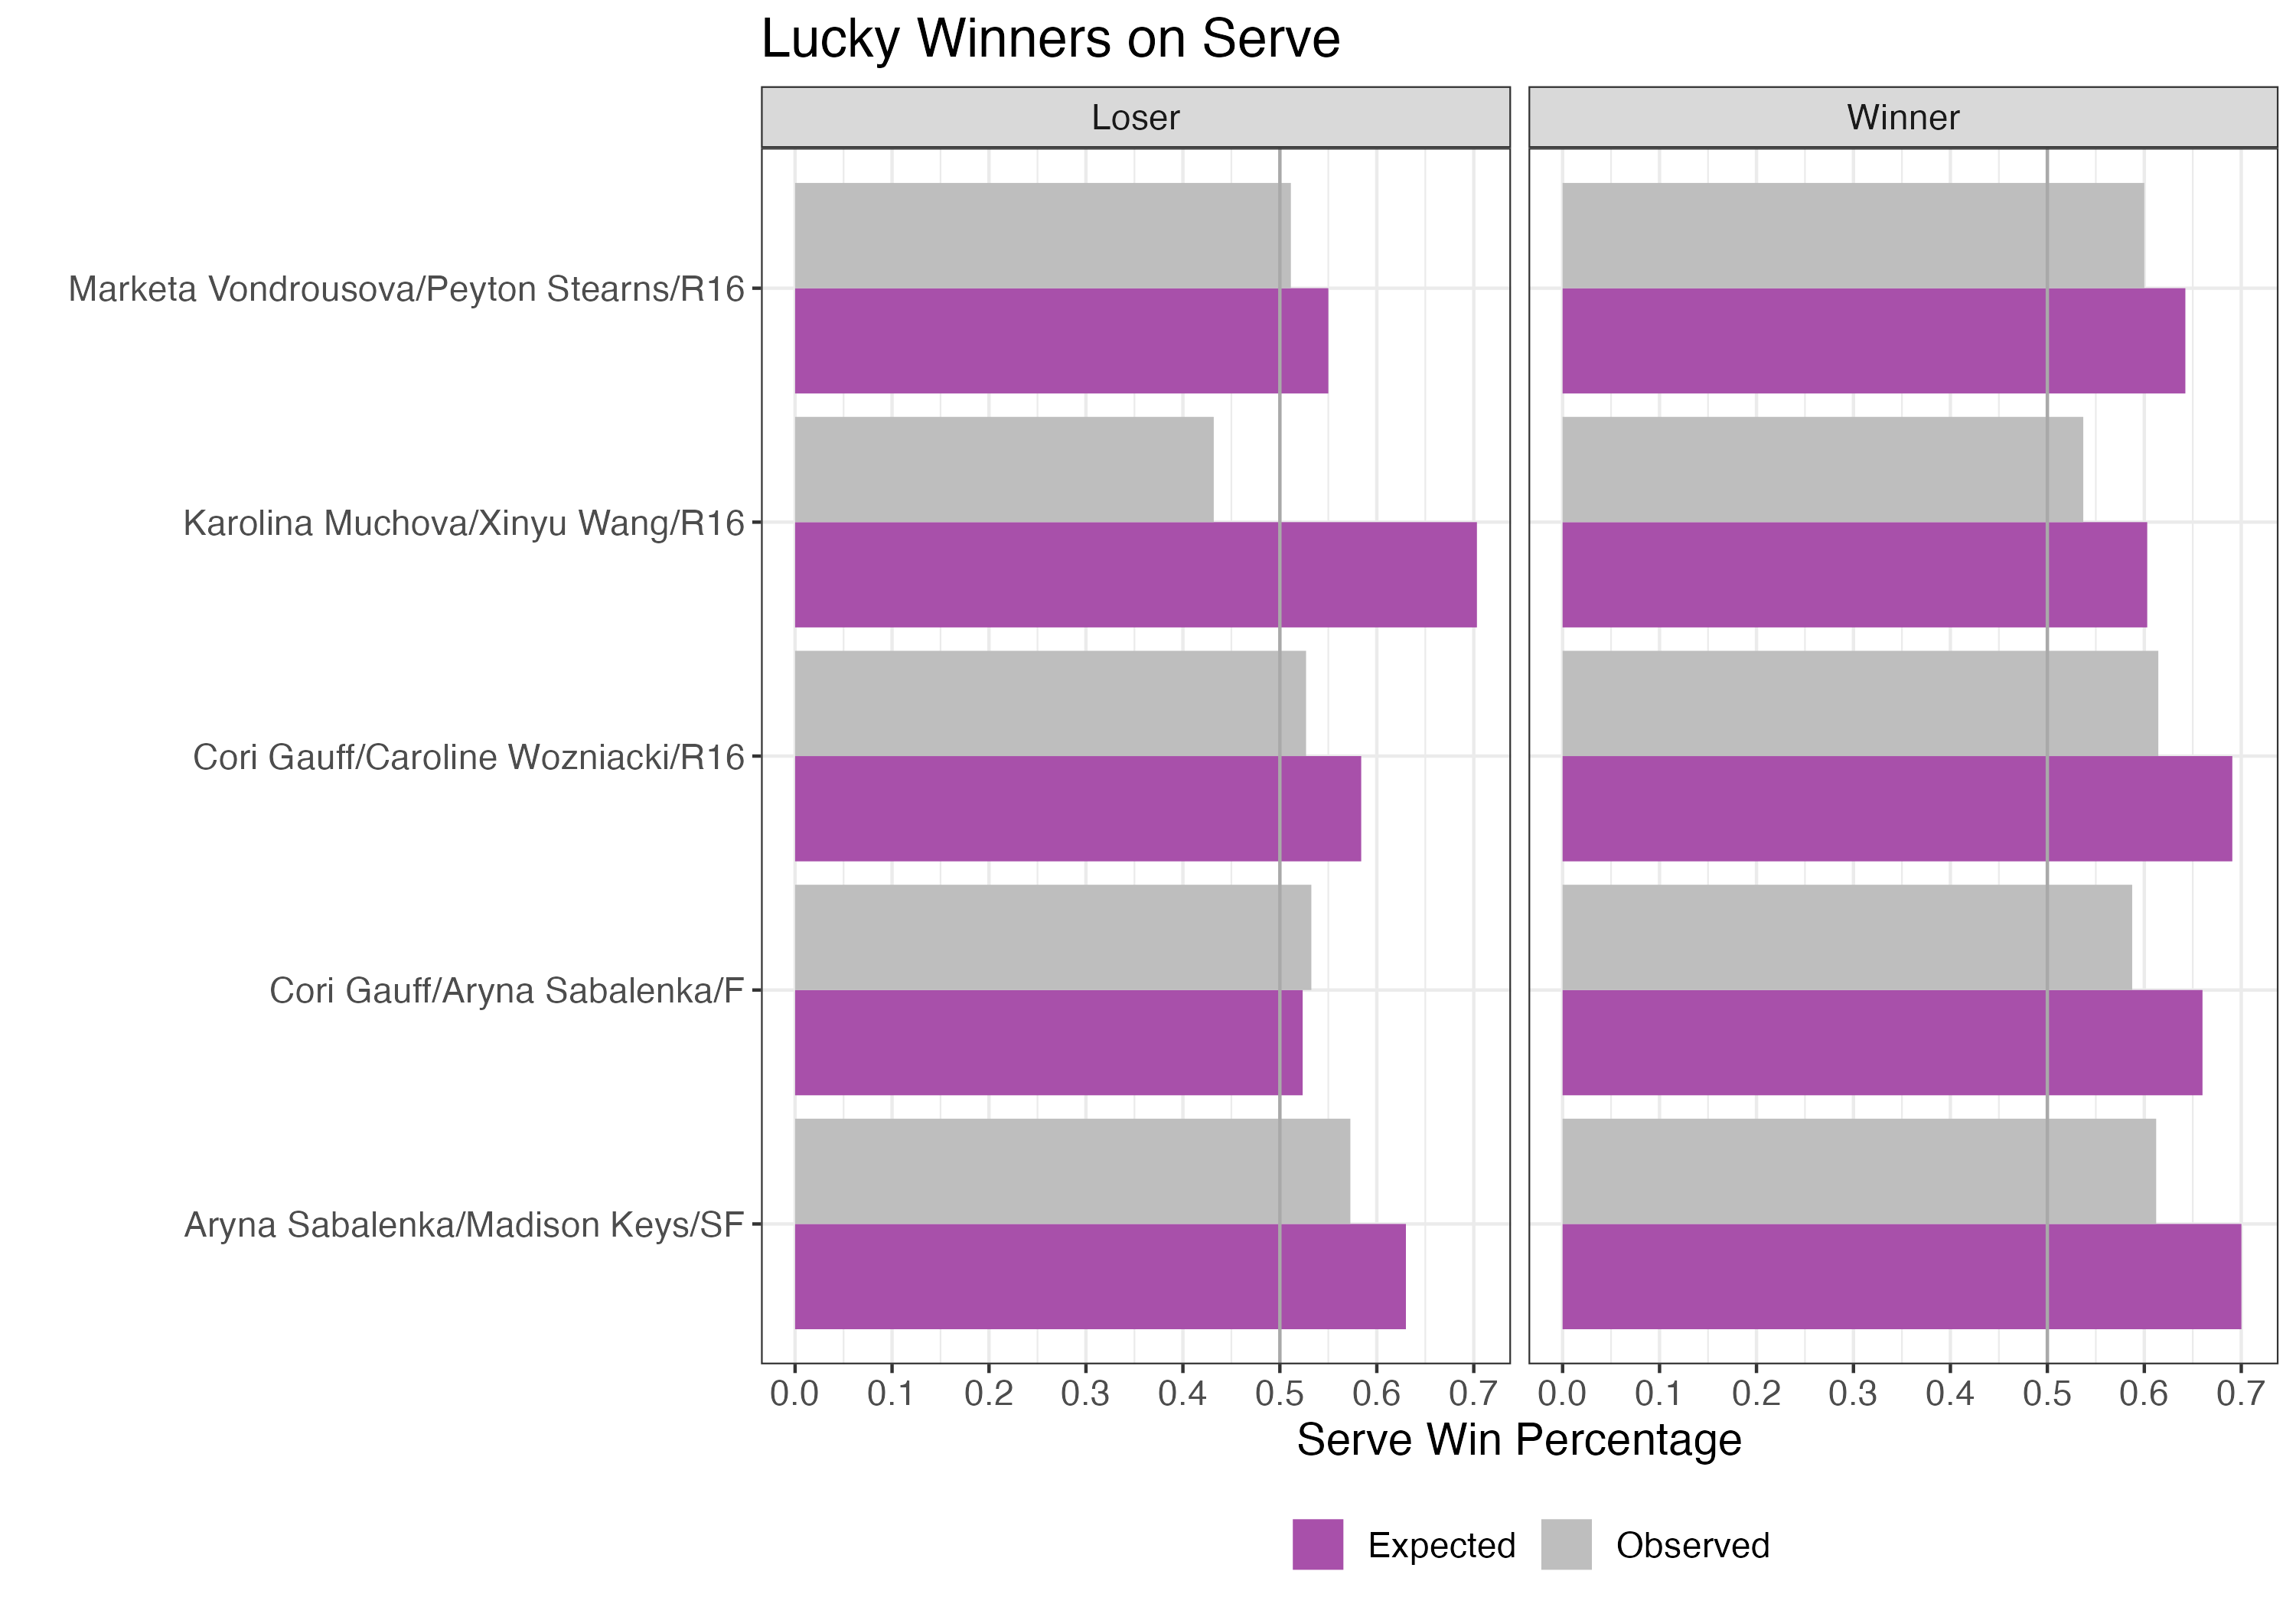
If we look at the women’s side, there are five match winners who were below expectation on serve (Figure 3). These include the women’s final and Aryna Sabalenka’s semifinal win. In the Sabalenka semifinal, Sabalenka was predicted to serve at a win percentage of 70%. Despite an actual win percentage of 61% and a bageled set, Sabalenka was still able to get the job done. In the case of the final, Sabalenka actually outperformed her serve expectation. Yet the 53% of points won was still too far behind Gauff’s 59% of points won on serve, no matter that Gauff was behind her expected serve potential for the match.
Figure 3. Match winners who performed below expectation on serve win percentage in the R16 or later along with their opponent’s performance.
There were fewer ‘lucky’ results on the return game in the later stages of the event. Yet two of Gauff’s return performances are included (Figure 4). This was a case to a very small extent in the final. The bigger escape for Gauff was the semifinal against Muchova, where Gauff was anticipated to have a high of 62% of return points won. The 50% of return points she actually won is another example where underperformance was still far ahead of what her opponent was able to come up with.
Figure 4. Match winners who performed below expectation on return win percentage in the R16 or later along with their opponent’s performance.

There are three main factors that could have a role in producing a ‘lucky win’ despite relative below-par performance from the match winner. The most common situation is that a winner who has underperformed still plays at a level that is better than their opponent – from the examples at the US Open we have seen that this is the usual pattern. It is also possible that a player simply gets lucky and plays just good enough on the important points to avoid a loss when playing below expectation overall.
The third possibility is harder to measure and that is the case where the expectation is actually misleading because it doesn’t account for some style clash or other factor. In the case of the women’s final, for example, the role of the crowd could have made for nerves and lower expectations on both sides of the net. It’s impossible for prediction models to account for these kind of intangibles and they are best left to speculation. The ability to find where player skill alone would suggest a surprising result at least gives us the means to see where some immeasurable factors may have been more critical or where someone’s event may have simply benefited from dumb luck.
Is it just me or does this statistic not make any sense, how come there are only 2 instances of players performing better then expected? Is this coincidence?